
After adjusting for inflation, wages are higher than at any point in U.S. history, and after adjusting for age and sex, the percentage of the population that is employed is around its peak in U.S. history.
This is great, and the economy is clearly way better than many of us feel in our wallets.
My problem with this framing is that the job market is just different today than it was a few years ago. In order to get paid what you’re worth, you basically have to be on the job market permanently. If you don’t hop from one job to the next, your wages will quickly stagnate. I like my job, and I get very small raises every year or two. My salary is reasonable, but not great, and the raises are usually 1-3%, barely inflationary. I know I could get way more if I put myself back in the market, but I don’t want to do that, because like I said, I like my job and have been there for 5 years. I don’t want to have to be a hustler to be paid what I’m worth, I want to be loyal to a company that pays me fairly. I probably need to get over this antiquated way of thinking, but just considering going back to selling myself on the job market gives me heartburn.
Don’t know who you work for, but it is a safe bet loyalty is foolish. You are at high risk for being dumped for little to no reason as soon as you become too costly. 1-3% raises are honestly shit and isn’t rewarding for increased experience/performance at all. Any company that barely (in fact since Covid 1-3% is not even) keeps up with inflation is flat out taking advantage of your apathy.
At that percentage, you are losing money every year. Ask them for more since you are worth as much, and if they refuse, then your loyalty isn’t being rewarded or even acknowledged.
So workers have caught back up to 1972. Hooray!
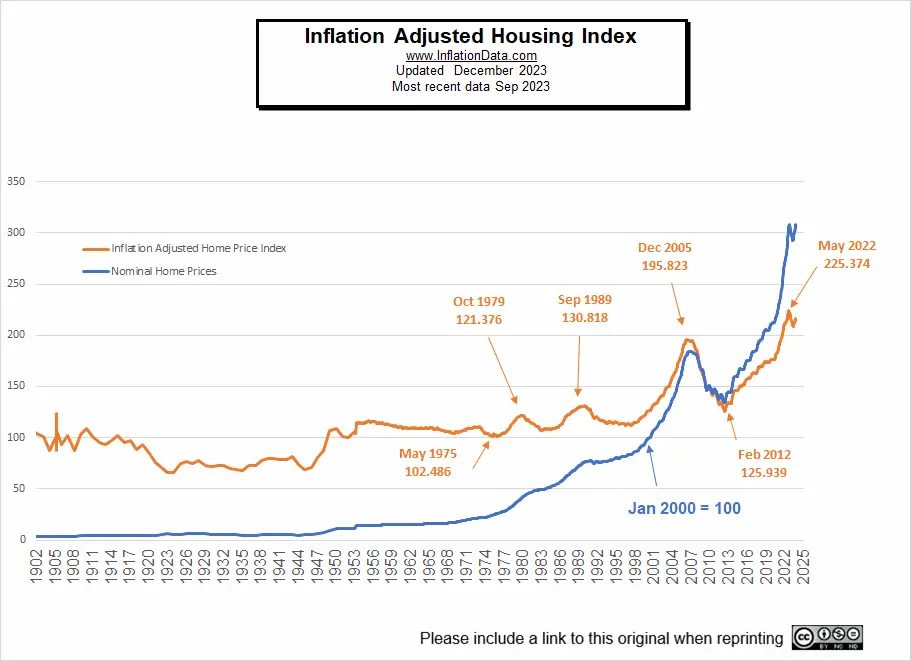
Too bad housing costs more than double now. Even after adjusting both to inflation $30/hr doesn’t cut it in the housing market now.
https://inflationdata.com/articles/inflation-adjusted-prices/inflation-adjusted-housing-prices/
The point of the inflation index is that it includes the same basket of things that people buy — including housing. There are some specific ways in which the official numbers can lag peoples’ experience (eg: how owners-equivalent rent is handled) but what you’re doing is suggesting something terrible, but not actually providing any real evidence for it.
1975 inflation adjusted housing price vs. 2023 inflation adjusted housing price. Sure, everything in the basket is adjusted for but the biggest single cost of any of our lives is now double. I can get a BigAss TV for $300 and subsidized milk for $3.70 but my house is $500k
Yes, but it’s included in the proportion to which you buy those things. So if you’re spending a lot less on other things, but more on housing, it’s a wash for your overall expenses. The point is that compared with overall expenses, wages went up more.
OK, so this is how my smooth brain thinks about it:
Housing is double when adjusted for inflation. Milk is obviously not. I think milk has stayed flat since they started tracking it in the '90s.
If I paid the same (adjusted for inflation) for my house and paid double (again, adjusted) for milk I would have a lot more money left over at the end of the month. I don’t think CPI takes into account how much milk I drink compared to the one house I need.
CPI does weight items by based on spending patterns (although the details of how to determine this weight are complicated and the main reason there are multiple inflation indecises).
The 2022 CPI has a 0.178% contribution from the price of milk, and a 45.065% contribution from the price of Housing. Housing itself is subdived into several subcategories. Notably, neither the purchase price of a house nor the typical mortgage are included. Instead, homeowners cost of shelter is covered by “owner’s equivelent rent” which attempts to answer what the owner would be paying if they had to rent the house they are living in.
The market basket approach they use looks at the mix of goods and services people buy. So yes, it captures the fact that housing is more of a typical person’s budget than milk.
I did a quick search and couldn’t find an answer.
I wonder if part of the disconnect is that they are using just a general “dwelling” in CPI. As opposed to price per square foot. That is, is dwelling size shrinking, while costs are growing, this could cause housing costs to be understated in CPI
That’s the whole point of CPI. It flattens a large aspect of capitalism into one magic number. It simplifies things for politicians and pals. But it’s not an objective measurement for meaningful science, especially as used in these types of articles (OP).
It captures the fact that housing is some percentage of people’s expenditures. But the measurement of housing and the percentage of expenditures are both subjective. It’s a choice of measurement not a capturing of some objective “fact”.
Yes, but it’s included in the proportion to which you buy those things. So if you’re spending a lot less on other things, but more on housing, it’s a wash for your overall expenses.
I may be misunderstanding, but doesn’t spending a greater percentage on housing necessitate spending less on other things? Someone who spends 50% of their earnings on shelter has to make more careful budgeting decisions than someone who only spends 30% on shelter. With a smaller portion of income to spend on anything else, people will put off purchases that they can’t afford. Using that proportional difference to claim “it’s a wash” sounds like circular reasoning. At least, it doesn’t seem to account for all the purchases people would have made if they weren’t putting such a high percentage toward this one basic need?
I don’t think that’s correct, but I’m no economist.
That’s literally a textbook definition of inflation.

Well something is wrong, because my equals in the 1970s had a higher quality of life than my peers do now. Maybe tradesmen just got left behind because those wages now include people making $150k as entry level programmers, etc.
It’s describing an average. There are definitely subgroups doing both better and worse
This is misleading from the first phrase. There is no way to calculate the “price level” because it doesn’t exist.
When people choose their “basket” and its weights, that subjective choice determines a “price level”.
There is no objective price level.
Drag doesn’t buy a TV every week! Drag pays rent every week.
Critically, if you want one of those really high paying jobs you need to work in a market with insanely high CoL - compensation increases haven’t been universal.
There’s no objective measurement of “inflation”. Inflation indexes are completely subjective and largely political.
If people want to use some index then they need to explain the index and justify it’s use. Otherwise they’re not providing any real evidence.
Yeah… This is an intentionally misleading study by a neoliberal think-tank that takes money from major anti-union corpos, the MIC, and investment bankers. Trying to sweep half a century of workers losing out behind fudged numbers to make it seem like wealth and income inequality, not to mention unfettered price-gouging isn’t the problem that reality says it is.
We’re about to break up google though /s
I’m sure that will go about as well as when they broke up Microsoft.
George Bush Jr. took the DOJ’s win in that case and basically let Microsoft off the hook.
Having said that, the fact that they were being prosecuted did limit their behaviour, and it’s why the FAANG companies were so successful. Now, we need a new round of antitrust to defang the FAANGs.
Absolutely. We need anti-trust laws to be un-Borked among other anti-monopolist measures. Not as a way to workaround the shortcomings of unfettered capitalism but because it’s the right thing for humanity.
Yeah, I don’t recommend trusting an article about american progress from americanprogress.org.
Have they ever found a case of american regression?
Glad to see they’ve adjusted for inflation, have they also adjusted for cost of living?
Edit: For anyone (such as OP) who is confused by these terms:
Very obviously not. This article is bullshit from head to toe.
That’s what adjusting for inflation is.
Nice propaganda.
That’s what it’s supposed to be, but clearly isn’t.
According to the BLS, the median wage (as of May 2023) is $23.11. At a 40 hour work week, 50 weeks per year, that’s a $46,110 annual wage.
Median rent for a 2 bedroom apartment (as of Nov 2023 is $1,904. That’s $22,848 annually.
So rent is 22,848/46,110 = 49.6% of income. Traditionally, this would be closer to 30%.
Wealth inequality is the highest it’s ever been. While I admire your optimism, the situation isn’t that great for the majority.
I agree that housing went up more than other parts of the market basket, and that we should build enough to force it down — indeed per your link rent is in fact slowly falling at this point.
Hourly wage is just as useless as unemployed percentages since neither count a large group of people. Unemployed statistics don’t count gig workers, service workers, etc., who are chronically underemployed. But even if you count their hours as a percentage you still would exclude all of the gig workers who are paid per job that can often span multiple hours. But none of that information is tracked, so it can’t be accounted for proportionally. So these stats are purposely worthless and tell the story that the wealthy want to tell so they can keep getting wealthier and pretend they aren’t taking that wealth from everyone else.
Looking carefully at figure 5A, it’s not as great as they want it to be. Even if the adjusted average wages have finally recovered after decades of low points, look at the rate before the drop and the rate leading up to now. And I will always question using just hourly wage as an indicator of how things are going when the first thing that happens when things tighten up is hours are cut. Still employed, still making X/hour, but net income is way down. Things are great. Sure. Then there’s the specter of underemployment, and working multiple jobs to make up for low income, probably due to not enough hours from the first job. But that wage number is great, right?
There’s always risk in life, and the world isn’t some perfect place. The point is that it’s actually improved recently, by any measure you might use.
They literally just explained why that’s not an accurate representation, by the specific measures detailed.
How do you benefit from clinging to an untruth?
How do you benefit from clinging to an untruth?
OP is objectively and demonstrably incorrect in a number of their claims. So your question is quite valid. Are they in sheer denial and this is a certain flavor of cope? Or are they actually intentionally spreading propaganda?
The moon gets it
They didn’t — what they did was raise a bunch of red herring type issues.
There are a ton of measures of unemployment which try to capture the kinds of thing they’re talking about, and they show similar imporvements.
I raised some points to consider, not to try and mislead anyone. How is underemployment or amount of jobs per worker doing? What is incorrect about how wage per hour isn’t the whole picture when your hours get cut?
U-6 looks at those kinds of underemployment numbers, and is doing pretty well:

This doesn’t mean it’s perfect, or everybody is now a sudden billionaire. It does mean that it’s within the range of “pretty much ok for most people”
Ah, didn’t realize you’re a person of the land, the common clay of the new West.
This community only believes the news when it’s bad.
While there are multiple ways to measure employment, the best single measure is the percentage of the adult population with a job, known as the employment-to-population ratio (EPOP). However, with a growing portion of the adult population becoming retirees, this measure is confounded by demographic trends over longer time periods. Many economists therefore focus on “prime-age EPOP,” or the percentage of people ages 25–54 with a job, as a way to account for the aging of the population. A more sophisticated method is to adjust for both age and sex. Adjusting for age accounts not only for the increase in retirees but also the aging within the 25–54 bracket. Adjusting for sex is necessary to analyze previous decades, when a much smaller percentage of working-age women were in the workforce. After adjusting for age and sex, the percentage of the population that is working is roughly at its peak height in U.S. history. This is also true if one looks directly at prime-age EPOP.
If we stop using the metric we always used, and invent a new one that says things are great, then things are great!
What else do you need expect from a Podesta organization that claims to be progressive?
The whole point of it is to convince people neoliberals are just as effective as progressives could be.
That’s why it’s funded by billionaires and opposed healthcare reform and other things billionaires don’t want.
https://en.m.wikipedia.org/wiki/Center_for_American_Progress
Just like with rightwing “think tanks” don’t just pay attention to the name or blindly believe what someone has chosen for a label.
I do find it interesting that the “actual” employment rate was 7% higher in 2000 than it is now. I get that we have an older population now, and proportionally more retirees as a result, but isn’t that relevant to our economic health? Rather than patting ourselves on the back for doing a good job despite an aging population, shouldn’t we be talking about how to turn this trend around? Italy, Japan, and China are about a generation ahead of us on this issue, and they’re totally freaking out - maybe we should too.
Yeah, the truth is it’s not that hard to find the right boxes to check as metrics that you can find any result you want.
Which is obviously what they did, they couldn’t even stop it with a 54 age cap (who the fuck retires at 55?) they had to raise the minimum to 25, well after normal college grad age.
Even without getting into the organization and funding, anyone that actually learned about stats in a real stats class can you tell you it’s being done to generate the results the funders want.
We really need to start teaching statistical analysis in highschool. I can’t remember the last time I needed something past algebra, but stats comes up all the fucking time, and almost no one really knows the basics.
It’s not even that complicated, but admittedly I had an amazing professor and took a couple courses.
A more educated populace is the last thing anyone at the top of the ladder wants.
We’re backsliding to Company Stores, chits, and union workers facing violence for their workplace rights. “Corporate interests” have undone the social contract.
Employment isn’t at an all time high - unemployment is pretty low… but a lot of non-working adults or underemployed adults don’t count as unemployed. A significant chunk of the population has just given up on trying to find a job.
I guess that is one way to present a nice picture for the people at the top. Here’s the way I see it. This neo-liberal experiment has been a massive disaster. We’ve allowed the elites to dismantle so much of our social safety net, and all for what… cheap smart phones with facebook? The very same phones that help power the culture war. A war so devastating it has captured and rotted the brains of large segments of our population.
Meanwhile, we the general citizens have been getting fleeced in one of the greatest transfers of wealth from the public to the private. And what are these elites doing with all their new wealth? Buying up every available asset that can produce a dollar and writing the rules to benefit those with excessive wealth.
I’ll leave with an example from the housing market, because it has been so popular lately and because it is a perfect example of this wealth transfer. This is broad and general. People and institutions over extended themselves and got drunk on paper asset inflation during the housing bubble. The gov’t bailed out the big institutions and stuck the common people with the bill. This resulted in tighter lending for the regular home buyer and cheap available funds for institutions such as hedge funds. So tons of available housing stock sitting on bank’s balance sheets were easy pickings for funds.
It will truly be a shock to the owner class when after extracting every last bit of value out of the planet they realize that they can’t eat money.
They can’t breathe it either.
It won’t protect them from drought or super hurricanes.
The bunkers they are building to ride out the doom they are sowing will be protected by men. Men who today are willing to accepts their slips of paper. But when that paper becomes worthless, they will slit their throats and sleep in their beds.
They are piling up paper that will turn to ash and they think they are oh so clever. They’ve been able to buy off and escape accountability in almost every domain. But the extraction has taken its toll on the earth, the delicate balance that the ecosystem exists in and the damage they have done can’t be fixed by buying a senator or even building a bunker.
It may be the only solace the rest of us have, man seems incapable of holding this class accountable, but reality doesn’t care. The laws of physics will not bend as easily as the law of man, and they will sit there with their bank accounts full of zeroes and impotently slap at the cold cement walls of the prisons they’ve built for themselves and they will know fear.
It’s not just the top; since the pandemic, wages at the 20th percentile are rising again:

Huh, tell that to all the laid off engineers that corpo thinks will be replaced with AI. There have been constant layoffs over the last couple of years in all sorts of industries.
Reducing the seats at the table to then claim the table is full, and thusly successful, is not honest, nor accurate.
That’s not how unemployment numbers work. It sucks that people are laid off but in the grand scheme of things unemployment is the lowest it’s ever been. Just cuz something bad happens to someone you know doesn’t mean the current administration is bad.
deleted by creator
It’s really gross how “full employment” is considered a good thing. Personally I think it’s miserable how people are forced to waste their lives serving capital. I would much prefer having “full freedom” or at least a 4-day work week. But those kinds of goals are completely outside the hegemonic narrative of economics.


